
In 2014 our colleague Ru created a tool in Google Scripts to support her testing in an organized and measurable way, using the Session Based Test Management method.
In 2016, two fixes were done by our colleague Adina, and a new version of the Session template was released. Later on, we combined the Session and the Report in a single document and shared them as a single Google Sheets file, available here:
For those of you just getting acquainted with SBTM
When doing exploratory testing, time-boxed sessions are a way to organize your efforts. Focused around an information objective – also called a mission or a charter – each session gives us the freedom to explore, designing and executing experiments that help us find the information we need.
During a session, we take notes – for our own personal use. We write down results of our tests, questions that arise, bugs we find, ideas we might have for a next session.
TBS – Test, Bug, Setup Time
James and Jonathan Bach, in their SBTM approach, suggest it’s useful to also take note of where our time goes during each session.
For example:
- Are we doing actual testing work, where we design and execute tests to uncover information? This counts as “Test” time.
- Are we doing bug investigation? Have we just found a behavior that might be considered a bug? Are we trying to understand the exact reproduction steps or its implications? This counts as “Bug” time.
- Are we doing “prep” or “setup” work to enable the actual testing activity? Are we, for example, installing the right tools, collecting / creating the right data, preparing access to the right servers? This counts as “Setup” time.
At the end of each session, it is interesting and useful to see where and how our time was spent, in terms of TBS (Test/Bug/Setup).
Another aspect we keep track of is whether or not we stay “on charter” during our session. We sometimes see an opportunity to explore an area that, even though it is “off-Charter“, has the potential to bring out such important information or uncover such big risks that it is worth abandoning our original goal for a short while.
You can read more about SBTM on James Bach’s blog here: http://www.satisfice.com/sbtm/
SBTM using Google Sheets
While we could take our own personal notes in any format, we at Altom created a template and some Google Scripts to help us keep track of our exploratory sessions.
You can find it here and you can just make a copy of it in your own Google drive to start using it:
The Google template contains two different types of sheets: the summary report sheet and the session sheets.
You can have more session sheets in one document, but only one summary sheet.
The Summary Report Sheet
The first sheet always contains a Summary report.
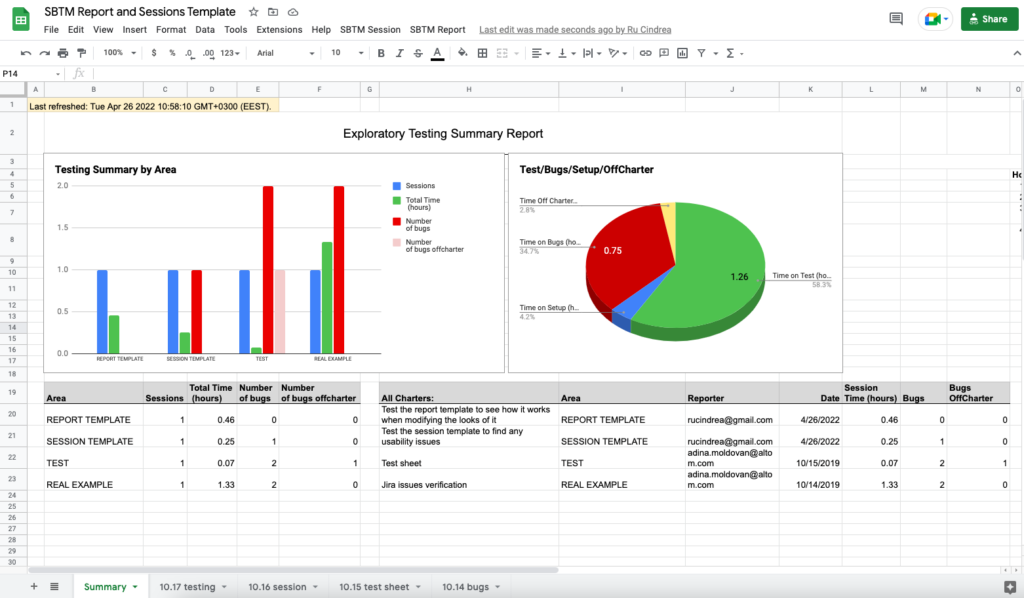
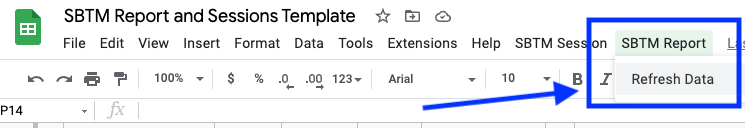
You can use the “Refresh data” button under “SBTM Report” to update the metrics based on all the session sheets you have in the same document:
The Session Sheets
The rest of the sheets are actual testing sheets with your notes. You can remove the sample ones that are present in the template and you can add any number of new sheets for any new session that you run.
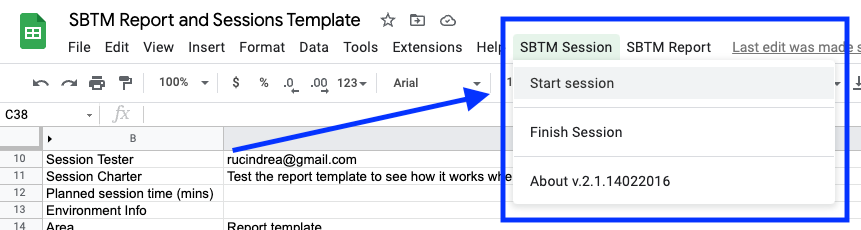
To create a new session:
- Add a new sheet and open it
- From the “SBTM Session” menu, choose Start Session
- Enter a charter name and click Start
Activity Tags: Test, Bug, Setup and Off-Charter
When taking notes, there are 4 main tags: Setup, Test, Bug, Off-Charter – which match the suggested types of activities that James and Jonathan Bach originally described.
Under each of these 4 main tags, we can have a few optional sub-tags, that will be counted under the main tag’s time:
- Note – this is the default tag used unless you specify something else.
- Question – we use this tag for any questions we have. You’ll be surprised that at the end of the session some of these questions will already have an answer. We highly encourage you to review your session sheets and leave no question unanswered.
- Next Time – if you have ideas that you don’t want to investigate now, “park” them under this label
- Data – if your testing is data driven, this tag will be very handy
- Bug OffCharter – this tag can be used when you notice bugs that are outside of your session’s focus
There is also an “Area” field in each session sheet. If you fill that in, the Summary report will group the metrics by these areas.
The colors on the tags at the end of each session will give you a visual indication of how your session went and what type of activity you spent most of your time on: Test, Bug, Setup or Off-Charter:
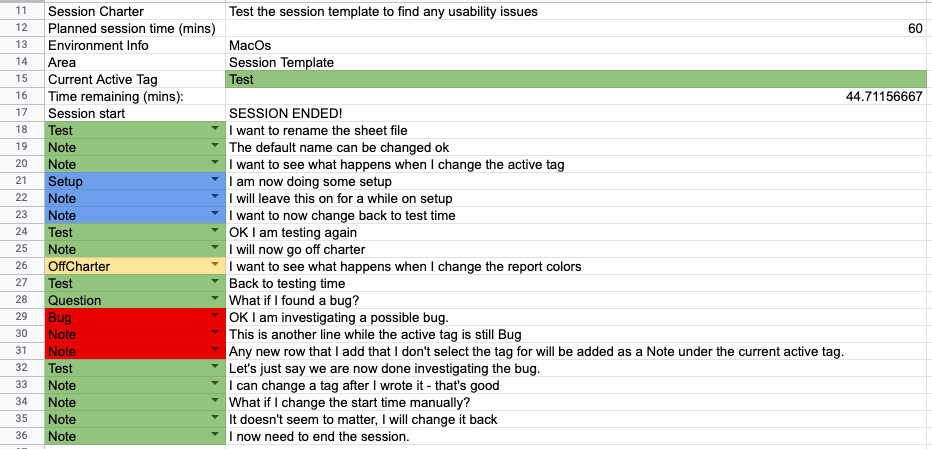
If you want to have this visual indication on all the sessions, check the Summary sheet and don’t forget to Refresh Data from the SBTM Report menu.
Happy testing!
Team Altom